Top Carbon Reduction Technologies Transforming Manufacturing, Ranked by Net-Zero Impact
Manufacturers don’t need another wish list—they need the best carbon reduction technologies for manufacturing ranked by impact, cost, and readiness. Here’s the short answer: start with electrification powered by renewables, stack efficiency and digital optimization, switch materials and close loops, then target hydrogen or CCUS for hard-to-abate loads and reserve engineered removals for true residuals. In the IEA Net Zero Scenario, electrification plus renewables deliver ~54% of required cuts, with efficiency adding ~13%—and since 2020, solar and wind have been the cheapest power in most markets (both findings summarized in the LSE explainer on net‑zero technologies and a 2025 carbon technology guide).
Strategic Overview
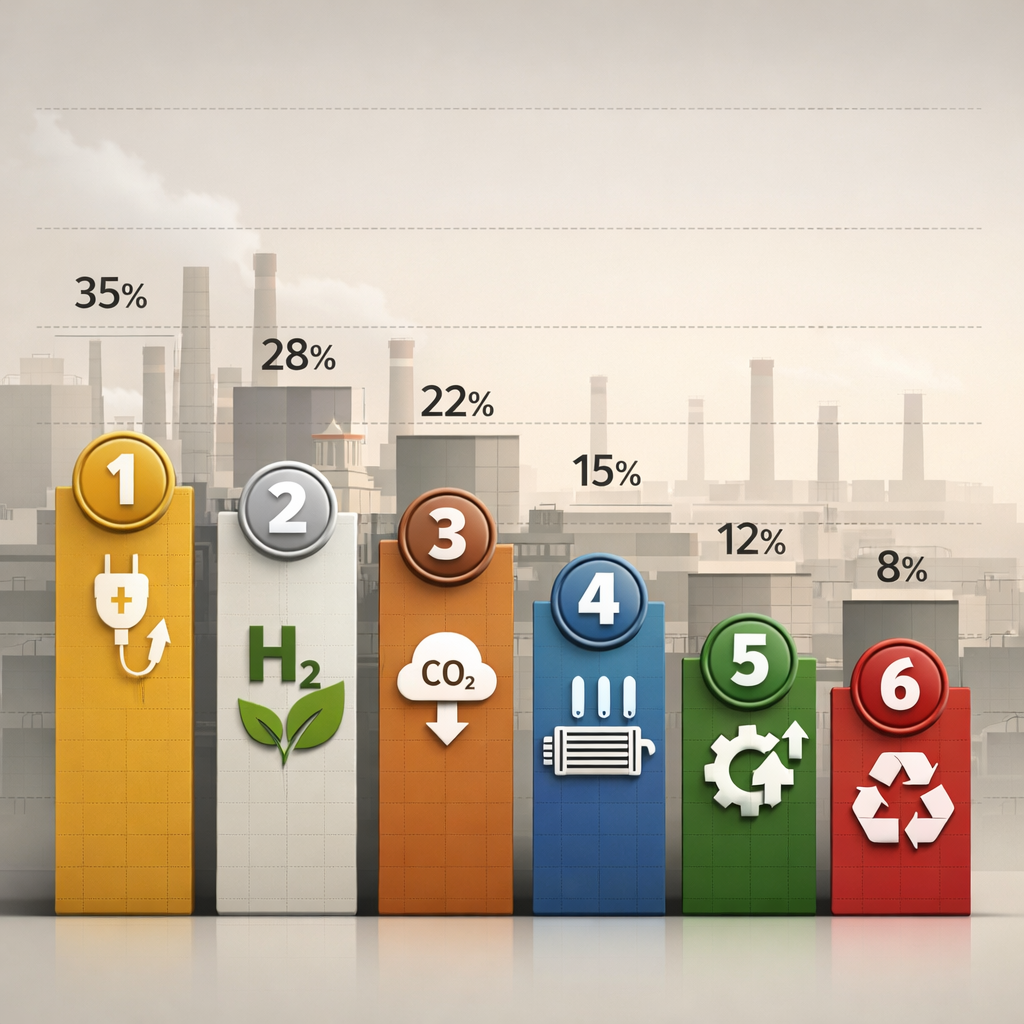
Executive summary—ranked by net‑zero impact, maturity, and $/tCO2e trajectory:
- Electrification with renewable electricity: biggest, fastest cuts across motors, drives, HVAC, and low/mid‑temperature process heat; cost-competitive power and scalable deployment.
- Energy efficiency and process optimization: the “first fuel” with fast paybacks; amplifies electrification value.
- Material substitution and circularity: durable, system‑level avoidance and, with mineralization, long‑lived storage.
- Waste methane capture and bioenergy: proven, near‑term abatement for organics and biogas to steam/power.
- Digital optimization and AI: low‑capex multiplier that locks in persistent savings.
- Low‑carbon hydrogen: targeted high‑temperature heat/reductant where electrons struggle.
- Carbon capture, utilization and storage (CCUS): essential for hard‑to‑abate point sources.
- Direct air capture (DAC) and engineered removals: premium solutions for residual emissions.
“Hard-to-abate emissions” (40–50 words)
Hard‑to‑abate emissions are CO2 or methane from processes that require high‑temperature heat, produce process CO2 inherently (e.g., calcination in cement), or run continuously with limited electrification options. They persist even with clean grids and typically demand CCUS, hydrogen, or material/process substitution to decarbonize.
“Net‑zero impact” (40–50 words)
Net‑zero impact is a technology’s ability to reduce or remove greenhouse gases at scale across manufacturing, considering technical potential, cost and learning curves, deployment maturity, energy and infrastructure needs, durability and permanence of reductions/removals, and reliance on enabling policies. High impact combines deep cuts, scalability, and credible permanence.
IEA anchor: Electrification, renewables, nuclear, CCUS, and hydrogen together can deliver most of the cuts needed for net zero by 2050; electrification+renewables ~54%, with efficiency ~13% (see LSE explainer on net‑zero technologies). Solar and wind are the cheapest electricity sources in most markets since 2020 (2025 carbon technology guide). Garbage Advice sequences these moves to minimize $/tCO2e, disruption, and payback times.
How we ranked net-zero impact
We prioritized technologies by: 1) abatement at scale across factories and supply chains; 2) cost per tCO2e today and cost trajectory; 3) maturity/readiness and supply availability; 4) permanence and additionality; 5) enabling infrastructure and power quality; and 6) policy dependence and operational risk.
Definition—net‑zero impact (40–50 words)
In this ranking, “net‑zero impact” means the credible, system‑level ability to reduce or remove emissions across manufacturing at scale, judged by current technical performance, learning‑curve cost decline, maturity, energy/infrastructure needs, permanence of outcomes, and policy reliance—not just pilot‑stage promise.
Comparison snapshot (directional, site‑specific)
| Technology | Role (reduce/supply decarb/remove) | Maturity | Typical $/tCO2e today | Key constraints |
|---|---|---|---|---|
| Electrification + renewables | Reduce (Scope 1–2), supply decarb | High | Varies by grid; often competitive per MWh | Grid carbon intensity, interconnection, high‑temp heat limits |
| Energy efficiency | Reduce | High | Often low/negative site cost | Attention/maintenance, measurement, change management |
| Material substitution & circularity | Reduce/avoid, some storage | Medium‑high | Product‑ and market‑specific | Standards, specs, quality consistency |
| Waste methane capture/AD | Reduce (CH4), supply energy | High | Often low to moderate | Feedstock quality, interconnects, air rules |
| Digital optimization & AI | Reduce (enabling) | High | Generally low | Data quality, skills, governance |
| Low‑carbon hydrogen | Reduce (heat/feedstock) | Medium | Site‑ and supply‑dependent | Clean H2 availability, safety, capex |
| CCUS | Reduce (point‑source) | Medium | Project‑dependent | Capture energy, transport/storage access |
| DAC & engineered removals | Remove | Early‑medium | See DAC section for current ranges | High cost, scale, permanence pathways |
Policy context: Carbon pricing currently covers about 23% of global emissions with prices spanning roughly $1–$130/tCO2, and EU allowances trading around $80–$90/tCO2 in 2025 (cited in a 2025 carbon technology guide). That price signal increasingly shapes procurement and project ROI.
Electrification with renewable electricity
Solar and wind have been the cheapest sources of electricity in most markets since 2020, and battery storage is steadily improving grid‑balancing and peak‑shaving economics (2025 carbon technology guide). This is why electrification, paired with clean power, is the highest‑priority lever for most plants.
Electrify first where it’s easy and fast:
- Motors, pumps, and compressors with premium‑efficiency units and variable frequency drives.
- Chillers, HVAC, and refrigeration with smart controls and heat recovery.
- Low‑ and mid‑temperature process heat: replace fossil boilers with electric boilers, heat pumps, induction, infrared, and microwave heating.
Tie these moves to Scope 2 reductions via renewable PPAs, virtual PPAs, high‑quality RECs, or on‑site solar plus batteries. Constraint to note: very high‑temperature heat, 24/7 duty cycles, and lagging grid decarbonization can limit near‑term full conversion. Still, in the IEA Net Zero pathway, electrification plus renewables account for about 54% of total reductions (LSE explainer on net‑zero technologies).
Definition—process electrification (40–50 words)
Process electrification replaces fossil‑fueled equipment and thermal steps with electric alternatives—motors, heat pumps, electric boilers, induction/IR heaters, and power electronics—so factories can run on low‑carbon electricity. It cuts Scope 1 combustion and, when paired with clean power, drives deep Scope 2 decarbonization with high controllability and efficiency.
Energy efficiency and process electrification
Efficiency is the “first fuel” because it pays back quickly and compounds later benefits. In the IEA Net Zero Scenario, technology performance and efficiency improvements contribute roughly 13% of total emissions reductions (LSE explainer on net‑zero technologies).
Prioritized checklist for fast ROI:
- Variable frequency drives and premium‑efficiency motors; right‑size pumps/fans.
- Compressed‑air leak detection and lower setpoints; eliminate inappropriate air use.
- Insulation upgrades and thermal sealing; heat recovery on ovens, compressors, and dryers.
- LED lighting with smart controls.
- Industrial heat pumps for low/mid‑temperature heat; smart HVAC and chiller sequencing.
Audit‑to‑ROI flow (directional guide):
- Step 1: Meter and benchmark (kWh/unit, steam per batch, compressed air leaks).
- Step 2: Rank by simple payback and operational risk; include a $/tCO2e column for each measure.
- Step 3: Implement low‑regret fixes (often 10–30% energy cuts in target systems).
- Step 4: Recommission, verify, and lock savings with digital controls.
Garbage Advice standardizes this audit‑to‑ROI workflow across sites to lock in verifiable savings.
Carbon capture, utilization and storage
Definition—CCUS (40–50 words)
CCUS captures CO2 from point sources (e.g., cement kilns, refineries, ammonia plants) or from ambient air, then either stores it in geological formations or utilizes it in products. Point‑source capture tackles hard‑to‑abate emissions where electrification or substitution can’t eliminate high‑temperature or process‑inherent CO2.
Where CCUS fits best:
- Cement kilns (process CO2 from calcination).
- Refineries and petrochemicals.
- Ammonia and SMR hydrogen plants.
- Some steel/blast furnaces and waste‑to‑energy facilities.
BECCS adds potential net‑negative outcomes by combining bioenergy with capture and storage; permanence and land‑use impacts must be evaluated (see the Frontiers review of DAC economics for broader engineered removal context). U.S. policy support includes 45Q tax credits at roughly $85/tCO2 for CCS, with higher levels for DAC and secure storage (2025 carbon technology guide). Infrastructure for CO2 transport and storage access remains a gating factor (see the UChicago comparison of carbon capture technologies).
Direct air capture and engineered removals
Definition—DAC and engineered removals (40–50 words)
Direct air capture uses chemical sorbents to extract CO2 from ambient air, enabling storage or mineralization with high‑durability outcomes. Engineered removals include DAC, mineralization, and biomass‑with‑capture. Buyers should assess permanence, additionality, and lifecycle impacts to ensure removals compensate only for truly residual emissions.
Costs and trajectories: The IEA and recent literature place DAC costs today in broad ranges—roughly $49–$270/tCO2, with 2022 estimates nearer $125–$335/tCO2 and learning‑curve projections spanning $100–$600/tCO2 depending on process and energy (Frontiers review of DAC economics). Climeworks’ Orca is currently the largest DAC plant; published targets aim for ~$100–$200/tCO2 by the mid‑2030s (UChicago comparison of carbon capture technologies). U.S. 45Q provides around $180/tCO2 for DAC with secure storage (2025 carbon technology guide). These are among the most expensive credits today; evaluate additionality and permanence case‑by‑case (see this review of tech‑based offsets).
Low-carbon hydrogen for heat and feedstocks
Definition—green hydrogen (40–50 words)
Green hydrogen is H2 produced via electrolysis powered by renewable electricity. When verified low‑carbon, it can serve as high‑temperature heat, a reductant for iron ore (DRI), or a feedstock for ammonia and methanol, enabling decarbonization where electrification is impractical or process chemistry requires H2.
Use hydrogen selectively: it is one of the core technologies expected to deliver large net‑zero cuts by 2050, but best reserved for very high‑temperature heat, reducing environments in steel, and chemical feedstocks when clean supply is available (LSE explainer on net‑zero technologies). Decision flow:
- Temperature and duty cycle: is heat >800–1,000°C and continuous?
- Fuel logistics: on‑site electrolysis vs delivered supply; storage footprint.
- Safety upgrades: detection, ventilation, Class I Div 2 areas.
- Burner/kiln integration: retrofits, NOx control, and materials compatibility.
Material substitution, circularity and mineralization
Material choices drive durable avoidance and, with mineralization, long‑lived storage in products.
Examples:
- Cement/concrete: clinker substitution (slag, fly ash, calcined clays); carbon‑cured concrete and mineralized aggregates.
- Steel: higher scrap content via EAF; DRI with green hydrogen.
- Plastics/chemicals: recycled content mandates, depolymerization, and emerging CO2‑derived intermediates.
- Mineralization embeds CO2 in stable carbonates for long periods within products (see this review of tech‑based offsets).
High‑impact substitutions
| Product | Strategy | Emissions impact driver | Readiness |
|---|---|---|---|
| Concrete | Clinker substitution; carbon curing | Less calcination/process CO2; mineralized storage | High (spec‑dependent) |
| Steel | Scrap‑based EAF; DRI + green H2 | Avoids coke/coal; cleaner reductant | Medium‑high |
| Polymers | Recycled content; depolymerization | Displaces virgin naphtha; lower process energy | Medium |
| Aggregates | CO2‑mineralized stone | Permanent CO2 storage in product | Medium |
| Glass | Higher cullet content | Lower melting energy per ton | High |
Waste methane capture and bioenergy
Definition—anaerobic digestion (40–50 words)
Anaerobic digestion breaks down organic waste without oxygen to produce biogas (mostly methane and CO2) and nutrient‑rich digestate. Captured biogas can fuel CHP, boilers, or be upgraded to renewable natural gas, converting methane that would otherwise escape into useful on‑site heat and power.
Landfill and farm‑scale methane capture are proven abatement tools, and some technology‑based offsets in waste and efficiency can deliver immediate reductions while projects scale (review of tech‑based offsets). Mini‑checklist:
- Quantify organic waste streams (food, biosludge, byproducts).
- Evaluate RNG interconnects and on‑site CHP potential.
- Confirm sustainability of biomass sourcing and local air rules.
- Align digestate handling with agronomic partners or composting.
Digital optimization and AI for efficiency
AI and machine learning now optimize energy through demand forecasting, anomaly detection, and predictive maintenance, often with low capex and fast ROI (2025 carbon technology guide). For factories:
- Predictive maintenance to reduce unplanned downtime, scrap, and energy waste.
- Digital twins for line design, utility setpoints, and virtual commissioning.
- Model‑in‑the‑loop control of HVAC, chillers, and compressed air.
Lowering barriers: industry coverage notes that efficient foundation models like IBM’s Granite can reduce AI compute costs by over 90% while maintaining competitive performance—useful for on‑prem analytics and edge deployment (see Greenly’s carbon accounting software roundup for adjacent enterprise tooling trends).
Phased rollout:
- Metering plan and data model (kWh/unit, steam per batch, scrap rate).
- Define KPIs and control boundaries; start with advisory mode.
- Advance to closed‑loop controls with human‑in‑the‑loop governance and M&V.
Garbage Advice helps plants stand up the data model, KPIs, and M&V so pilots scale and persist.
What this means for small and mid-sized manufacturers
A staged roadmap keeps things practical and financeable. Garbage Advice builds these roadmaps and prioritizes actions by $/tCO2e and downtime risk.
- Now: energy audits; VFDs and premium motors; compressed‑air fixes; LEDs; insulation; heat pumps where feasible; lock in green power contracts.
- Next: digital optimization; heat recovery; electric boilers; pilot hydrogen only where clearly justified.
- Later: CCUS via cluster hubs; material‑substitution partnerships with buyers.
Funding levers to watch: compliance and voluntary carbon markets are approaching a few billion dollars annually with premium removals often >$100/tCO2; 45Q credits for CCS/DAC; and generous utility rebates (2025 carbon technology guide). Favor modular, drop‑in equipment—mirroring maintenance culture from everyday disposals and grinders. As with Garbage Advice–vetted selections and models from Waste King, GE, InSinkErator, and Whirlpool, choose solutions that are quiet, right‑sized, and serviceable; uptime and parts availability matter as much as headline efficiency.
Waste and circularity links to facility operations
Bridge corporate carbon goals with daily waste decisions:
- Segregate organics to enable anaerobic digestion or RNG contracts; right‑size compactors, bins, and pickup cadence.
- Elevate recycled‑content procurement; add take‑back/repair loops for components and packaging.
- Build playbooks for contamination control, baler specs, and glass/plastic stream handling, and ensure safe removal practices for equipment changes.
This is Garbage Advice’s wheelhouse: tighter waste operations reduce virgin material demand and energy, cut methane leakage, and make decarbonization tangible on the shop floor—much like specifying quieter, properly powered disposals minimizes downtime and wastewater issues in cafeterias and test kitchens.
Procurement, policy and financing considerations
Definition—carbon pricing (40–50 words)
Carbon pricing assigns a cost to greenhouse‑gas emissions through taxes or cap‑and‑trade, steering markets toward low‑carbon choices. In 2025, pricing covered ~23% of global emissions, with rates spanning roughly $1–$130/tCO2 and EU allowances around $80–$90/tCO2, shaping investment and procurement decisions (2025 carbon technology guide).
Procurement levers:
- Green PPAs and REC strategy; contracts with 24/7 matching where feasible.
- RFQs that specify product‑level carbon intensity and recycled content.
- Vendor data sharing for Scope 3; align EPDs with customer specs.
Garbage Advice helps align RFQs, recycled‑content targets, and vendor data with circularity and carbon goals.
Software and deployment costs to plan for: Garbage Advice helps teams right‑size the platform mix and avoid shelfware.
- Salesforce Net Zero Cloud up to roughly $210,000/year; IBM Environmental Intelligence Suite up to ~$134,000/year; Emitwise up to ~$127,000/year; Plan A often >$10,000/year (Greenly’s carbon accounting software roundup).
- Sweep supports Scopes 1–3 with typical deployments in 2–4 weeks and under one day of client time; Net Zero Cloud’s data model may limit complex calcs (Seedling’s carbon management platform guide).
- Plan A’s tools are TÜV‑certified and comply with SOC2 and GDPR (Plan A academy on carbon accounting tools).
Bottom line recommendations for manufacturers
A six‑step, action‑ready playbook:
- Measure baselines (Scopes 1–3) and set targets.
- Do low‑regret efficiency first; electrify what you can; lock in renewables.
- Add digital optimization for persistent savings.
- Substitute materials and close loops.
- Evaluate hydrogen/CCUS for true hard‑to‑abate loads.
- Use high‑quality removals for residuals only.
When in doubt: prioritize the lowest $/tCO2e first, then scalability, then permanence.
Market context: climate‑tech supply is maturing fast, with total markets projected to expand sharply through 2035 from a 2025 base (2025 carbon technology guide)—meaning more vendors, lower costs, and better fit for your plant.
Frequently asked questions
Which manufacturing processes are easiest to electrify today?
Low‑ to mid‑temperature heat (hot water/steam), HVAC, motors, pumps, compressors, and process heating via induction or IR are typically easiest. Garbage Advice can map and prioritize these conversions by $/tCO2e and downtime risk.
Where does CCUS make the most sense versus full electrification?
CCUS fits hard‑to‑abate, concentrated CO2 streams—cement kilns, refineries, ammonia, and some steel—where high‑temperature or process emissions persist. Garbage Advice helps assess CCUS versus electrification trade‑offs and timing.
When is low-carbon hydrogen a better choice than electric heat?
For very high‑temperature processes, reducing environments (e.g., DRI steel), and chemical feedstocks like ammonia or methanol—especially when clean power is constrained on‑site and verified low‑carbon hydrogen supply is available at competitive cost. Garbage Advice builds decision flows that stage pilots only where hydrogen is justified.
How fast can digital optimization deliver measurable reductions?
With metering in place, AI‑driven controls and predictive maintenance can start reducing energy and scrap within weeks to a few months, often with low capex. Garbage Advice sets up data models, KPIs, and M&V so results stick.
Does circular design and recycling really cut factory emissions?
Yes. Using recycled inputs and designing for reuse/repair lowers demand for energy‑intensive virgin materials and reduces process energy; Garbage Advice ties these choices to facility waste ops for measurable results.